Project Summary
For my Computing Methods II final project, my teammate Abby Swindler and I developed the France Day Trip Planner, an interactive travel planning tool that helps users build a personalized two-day sightseeing itinerary based on their travel interests. The user ranks travel categories such as food, museums, nightlife, nature, shopping, and historical attractions. The program then recommends cities, generates a two-day itinerary, and optimizes the route between attractions.
This project connects to Industrial Engineering because it combines decision support, data filtering, and route optimization to improve a planning process. Instead of manually comparing cities and attractions, the software uses user preferences and distance calculations to create a more efficient travel plan. The route optimization portion also applies a Traveling Salesman Problem (TSP), a common Operations Research model used to determine an efficient path between multiple locations.
Important skills practiced during this project included:
- Building a Vaadin user interface
- Reading and organizing CSV data with Tablesaw
- Using the OpenTripMap API to gather live attraction information
- Applying Google OR-Tools to solve a Traveling Salesman Problem
Project Development Process
Originally, we had the idea of designing the model so that users could select a country they wanted to visit, after which the program would provide a list of attraction categories to help build their itinerary. However, this approach presented several challenges, particularly with limited user selections and issues in generating detailed attraction-based itineraries on a country-level scope.
To address this, we shifted our approach: instead of choosing a country first, users would select the types of attractions they were interested in, and the program would recommend a country that best matched those preferences. While this helped with personalization, it introduced a new issue- processing the massive amount of data needed to evaluate attractions across multiple countries would require a very large and complex API.
As a result, we refined our goal further by focusing on cities within a single country, France, rather than comparing whole countries. After having multiple setbacks with finding data using APIs, we opted to generate our own data set of attractions for various cities in France using AI. During this process, we realized that listing cities without considering their size would bias the results toward larger cities, which have more attractions and higher populations.
To fix this issue, we introduced a city-size filter as an additional constraint. This allowed the model to better match user preferences with appropriate destinations, rather than defaulting to major cities. Once we established this data set and incorporated the necessary constraints, the model development progressed much more smoothly, and the optimization process became significantly more effective.
Toward the end of the project, we identified an API derived from OpenStreetMap that aligned well with our needs and operated efficiently within our constraints. This led to a final adjustment of moving from our AI-generated data set to real-world data from the API, which provided a broader and more dynamic set of information for generating user itineraries.
After all of these changes, I believe that this model matched our expectations. It ended up being on a much smaller scale than our original design, but the model provides a detailed itinerary for cities in a specific city and gives the optimized route. Even thought the final result changed by a lot, the goal of the project was still achieved.
Key Features and Highlights
Preference-Based City Recommendations
The first major feature is the preference ranking system. The user ranks six attraction categories from most important to least important. The program uses these rankings, along with the selected city size, to recommend the top matching French cities.
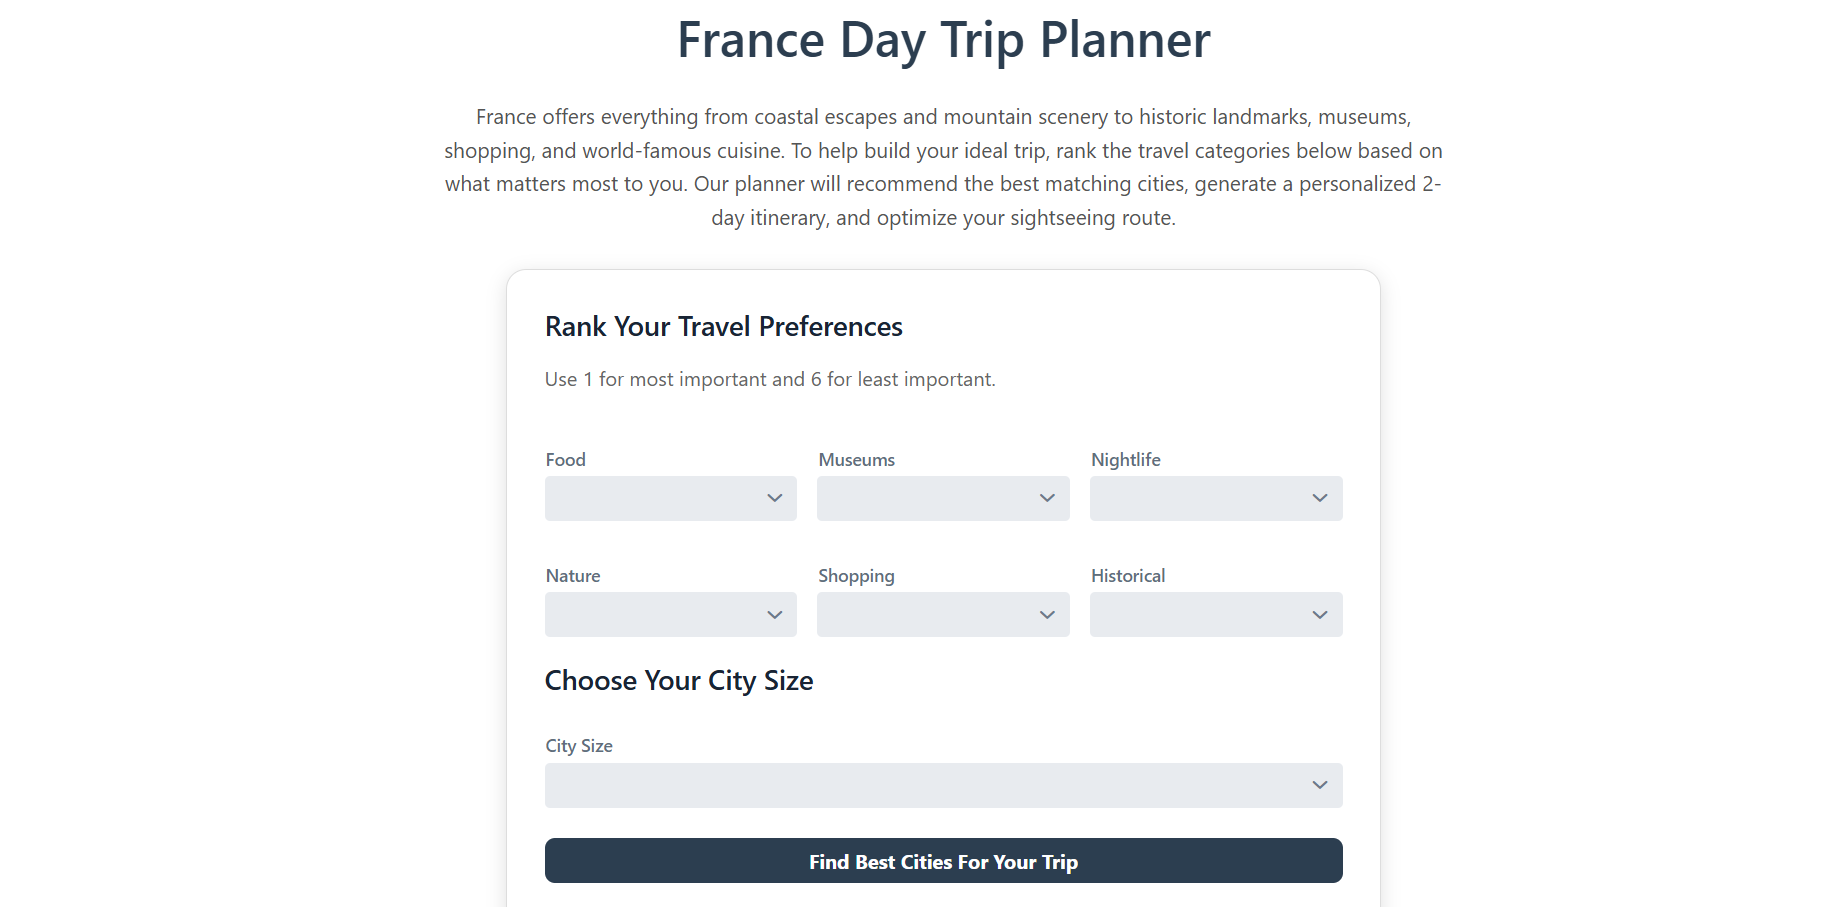
Figure: User preference ranking screen where travelers rank attraction categories and select a preferred city size.
Interactive City Selection
After preferences are submitted, the user sees three recommended city cards. Each card includes an image, city name, and short description. When the user hovers over the image, a blur effect and overlay text appear to make the interface feel more interactive.
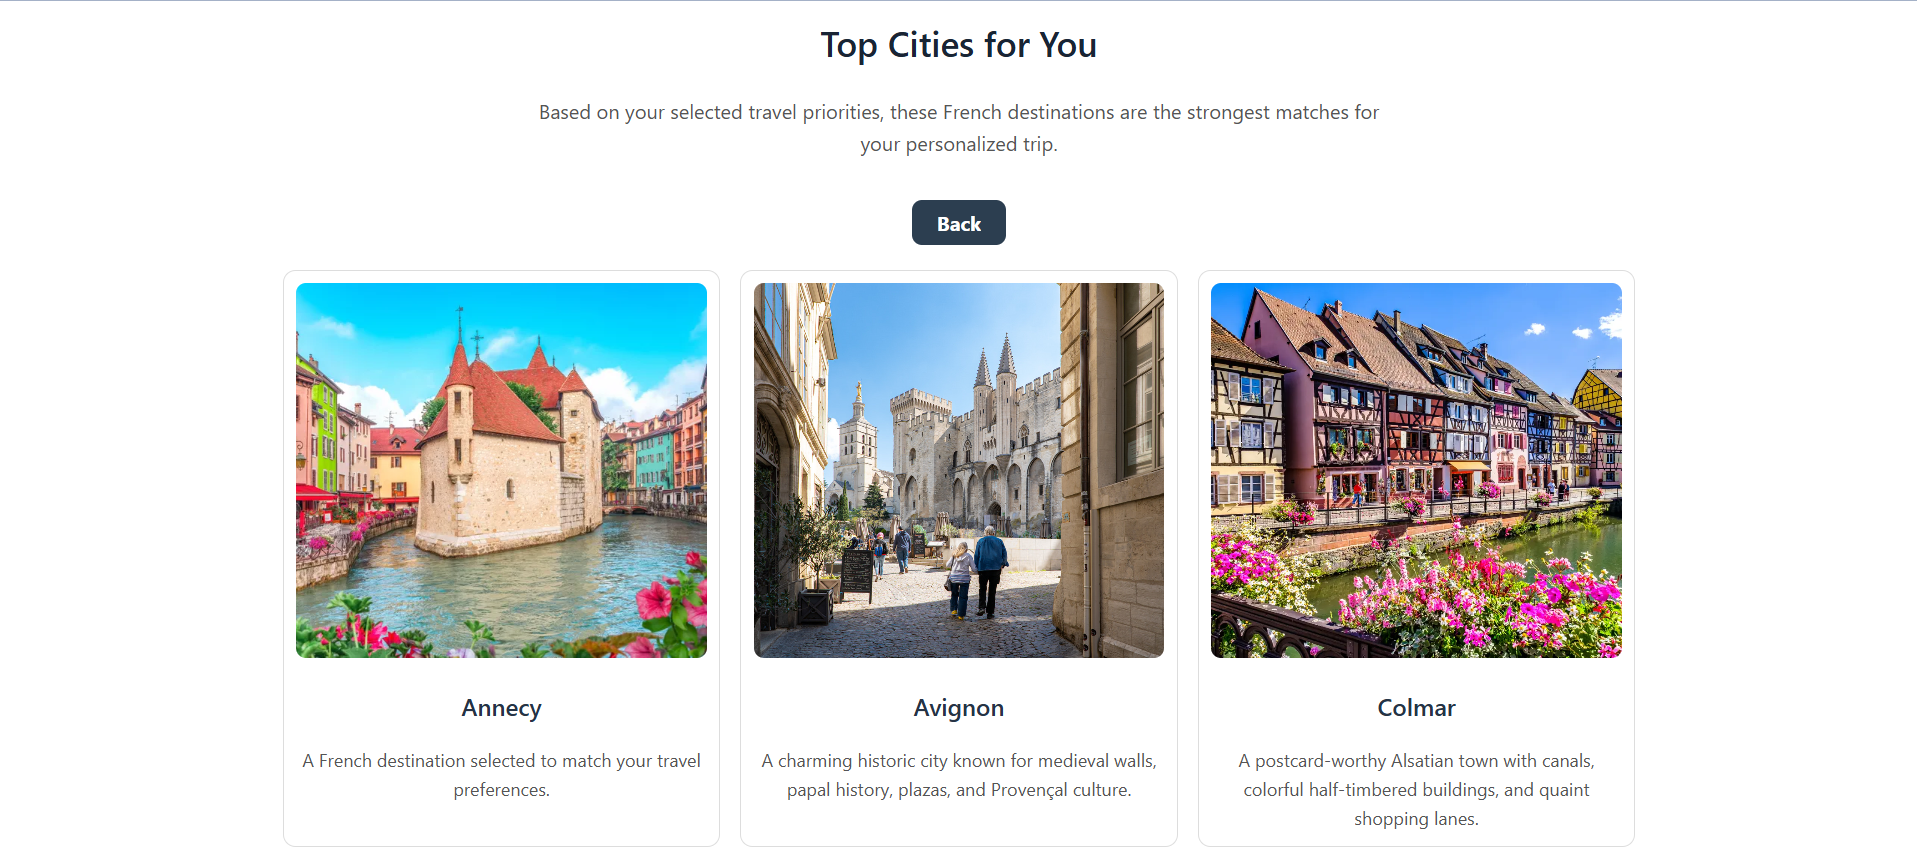
Figure: Top recommended French cities displayed after evaluating the user’s ranked travel preferences.
Two-Day Itinerary Generation
Once a city is selected, the program generates a two-day itinerary with up to eight attractions. The itinerary is split into four attractions for Day 1 and four attractions for Day 2. This makes the output easier for a user to follow compared to one long attraction list.
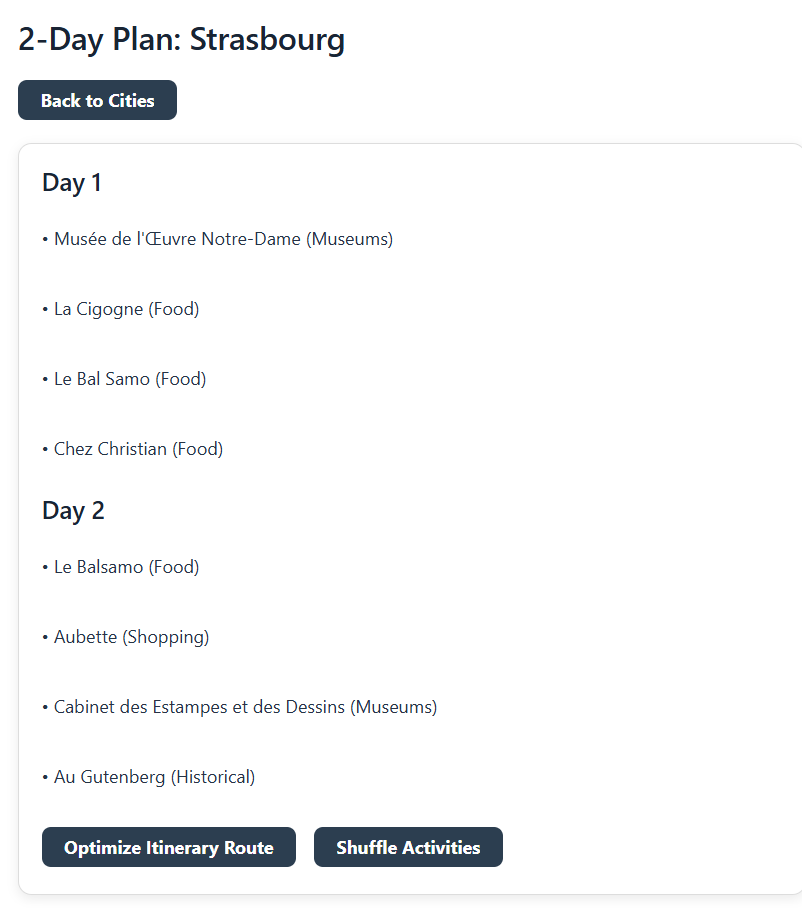
Figure: Personalized two-day itinerary generated from the selected city and attraction preferences.
OR-Tools Route Optimization
The most advanced feature is the route optimization step. The program builds a distance matrix between attractions and sends it to Google OR-Tools to solve a Traveling Salesman Problem. The optimized output shows the best order to visit attractions for each day, along with Google Maps links and total route distance.
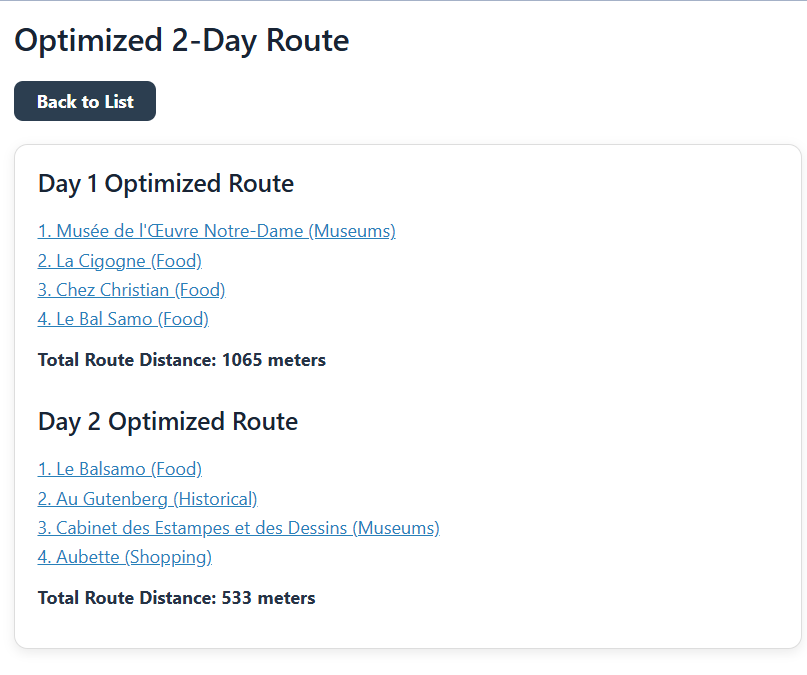
Figure: Optimized sightseeing route generated with Google OR-Tools.
Reflection
This project helped me better understand how object-oriented design, user interfaces, APIs, and optimization can work together in one application.
One part of the project I am especially proud of was designing and improving the Vaadin user interface throughout development. As the project evolved, I focused heavily on making the application feel more interactive and user-friendly rather than just functional. This included redesigning layouts, adding hover effects and overlay text to city cards, improving page organization, creating styled itinerary and route displays, and refining the overall user flow between screens.
I also learned a great deal from debugging the route optimization process and integrating live attraction data through the OpenTripMap API. Working through these issues helped me become more confident in debugging larger projects and understanding how different program components interact with each other.
Overall, this project strengthened both my technical programming skills and my ability to think about software from the perspective of the end user. It also showed me how Industrial Engineering concepts such as optimization and decision support can be applied to real-world travel planning problems.